
Dashboard and Reporting : Meta Ad Widgets
This article introduces the powerful Meta Ad Widgets feature designed to enhance reporting and dashboard capabilities. Businesses can seamlessly visualize and track essential advertising metrics such as clicks, conversions, impressions, and spending directly from their dashboard or reports. Whether you're monitoring campaign performance or identifying trends in your paid traffic, these widgets simplify data analysis for more informed decision-making.
Key Features & Benefits
Meta Ad Performance Widgets
- Website Purchases – Number of purchases made through social-driven traffic.
- Meta Ad Clicks – Total clicks on your ads.
- Amount Spent – Total ad spend within a selected timeframe.
- Cost Per Conversion – Average cost for each conversion.
- Average CPC – Cost per click across ads.
- Ad Impressions – Total times ads were displayed.
- CTR (Click-Through Rate) – Click percentage relative to impressions.
- Average CPM – Cost per 1,000 impressions.
- Conversions – Total desired actions like signups or purchases.
- Reach – Unique users who saw your ad.
Top Campaign Ranking Widgets
Widgets that highlight top-performing campaigns based on specific metrics:
- Top Campaigns by Ad Spend
- Top Campaigns by Conversions
- Top Campaigns by Website Purchases
- Top Campaigns by Ad Clicks
- Top Campaigns by Impressions
- Top Campaigns by Reach
Benefits at a Glance
- Centralized Ad Monitoring: View ad performance directly in one place, dashboards or reports.
- Actionable Insights: Easily identify top-performing campaigns and areas that need optimization.
- Trend Analysis: Compare performance over time with visual tools to track ROI and growth.
- Custom Reporting: Tailor dashboards to show only the data that matters most to your team or clients.
- Scalable for Agencies & Teams: Suitable for single users or large teams managing multiple campaigns or accounts.
How to Use Meta Ad Widgets
Follow these steps to add and customize Meta Ad Widgets:
Open Your Dashboard or Report
- Navigate to the analytics section where dashboards or reports are configured.
Click on “Edit”
- This opens widget customization options.
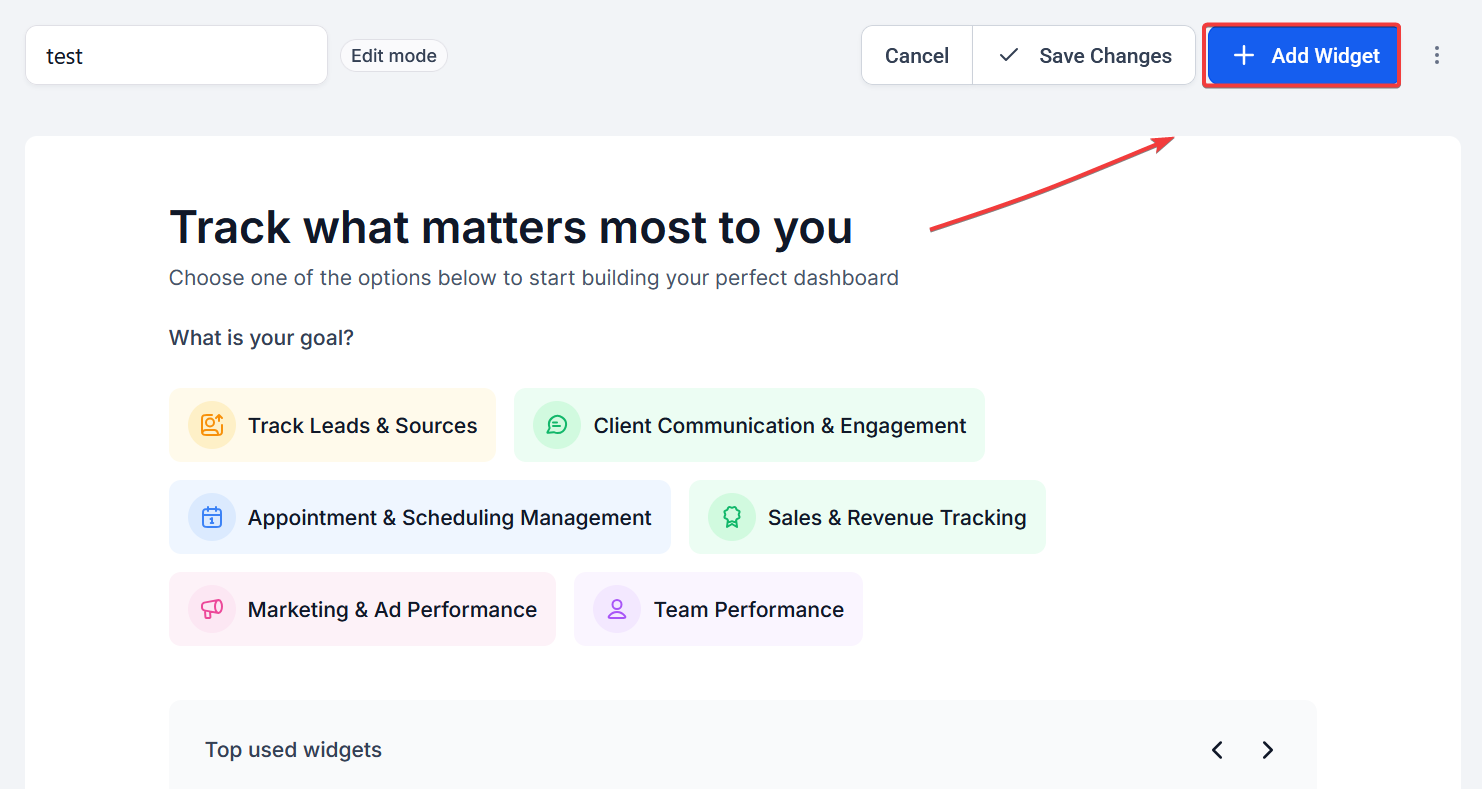
Select “Add Widget”
- A widget library will appear.
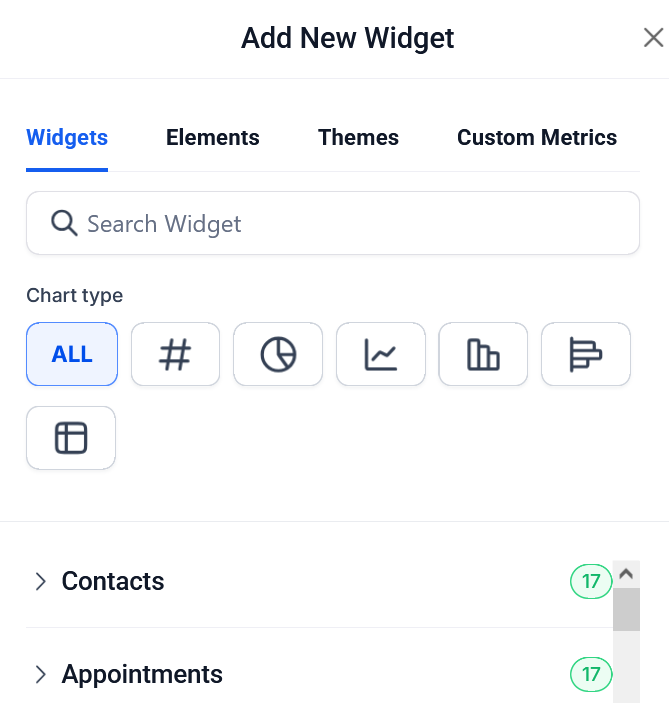
Scroll to the "Meta" Category
- Find widgets listed under this category to represent ad metrics.
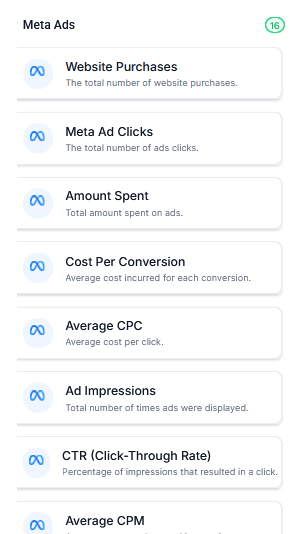
Choose the Desired Widget
- Select metrics like Ad Clicks, Impressions, Conversions, etc.
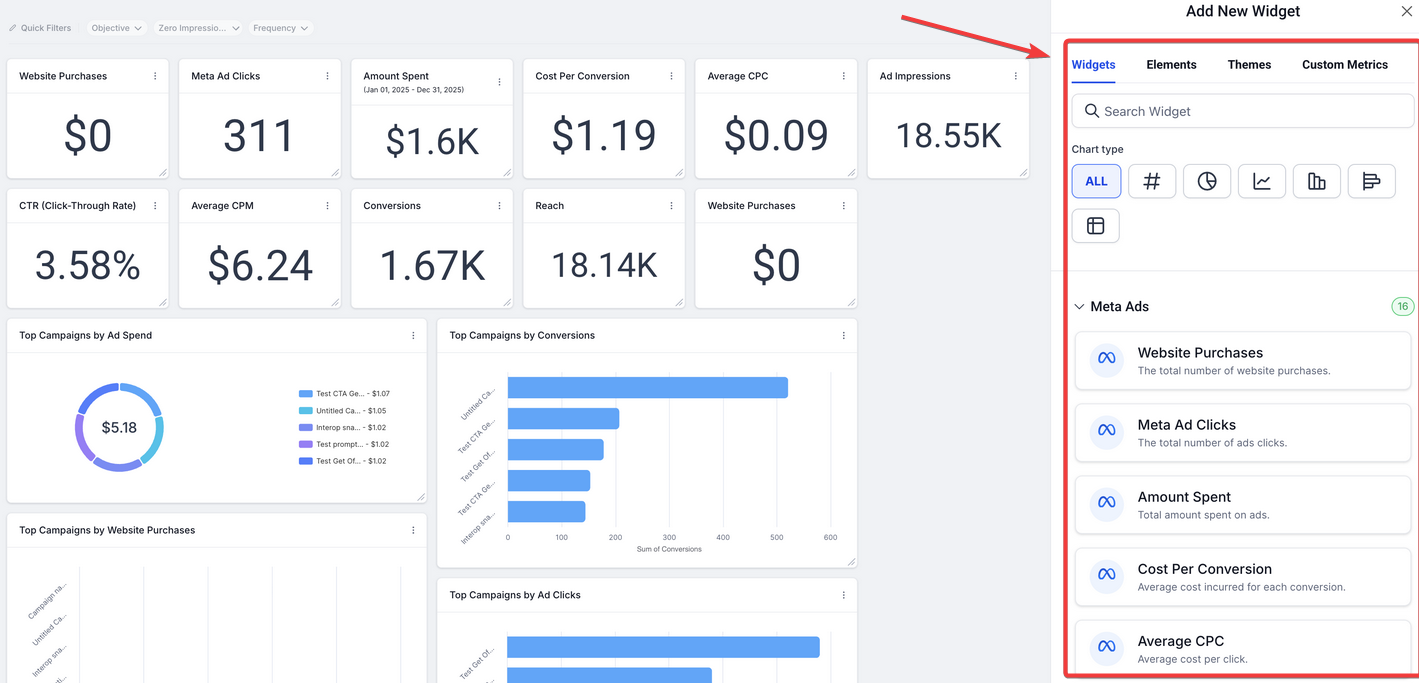
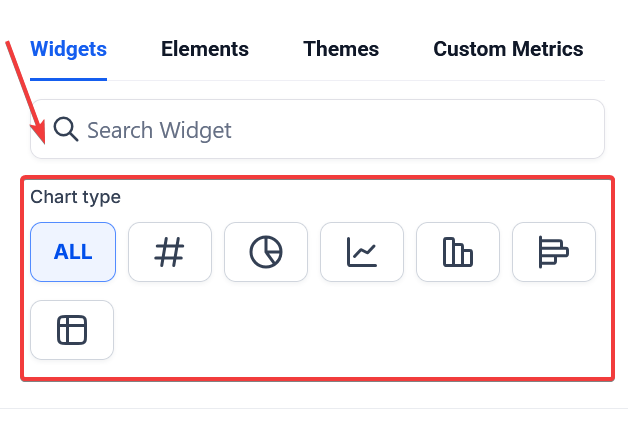
Customize Display Options
- Apply filters (date ranges, campaigns), select chart types (bar, line, table), and adjust visual themes.
Click “Save”
- Finalize the dashboard or report with your selected widgets.
Pro Tips
- Use Filtering for Deeper Insights: Apply filters to break down data by campaign, ad set, or date range. This makes it easier to spot trends or anomalies.
- Combine Widgets Strategically: For example, place Ad Spend next to Conversions to instantly calculate cost-efficiency.
- Duplicate Dashboards: Create variations for different departments (e.g., marketing vs. finance) with only the relevant widgets.
- Theme Matching: Apply custom colors or themes to align with your company’s branding or reporting style.
- Limit Overload: Avoid adding too many widgets in one view. Focus on the KPIs that influence your decision-making most directly.
Frequently Asked Questions (FAQ)
1. Do Meta Ad Widgets update in real-time?
Yes, metrics are regularly synced and reflect the most recent available data based on the platform's refresh intervals.
2. Can I use Meta Widgets across multiple dashboards?
Absolutely. Widgets can be added to any number of dashboards or reports to tailor views for different teams or clients.
3. What if I don’t see the Meta category in the widget selector?
Ensure that Meta Ad data is integrated and permissions are granted. You may need to confirm data sources are properly configured within your system.
4. Can I export dashboards or reports with Meta Widgets?
Yes. Most platforms support exporting reports with widgets in PDF or CSV formats. However, check for any limitations based on widget types or visual elements.
5. Is there a limit to how many widgets I can add?
While there is no strict limit in most cases, performance may be impacted with too many visual elements. It's recommended to organize data across multiple dashboards if needed.